A live feed you can actually search
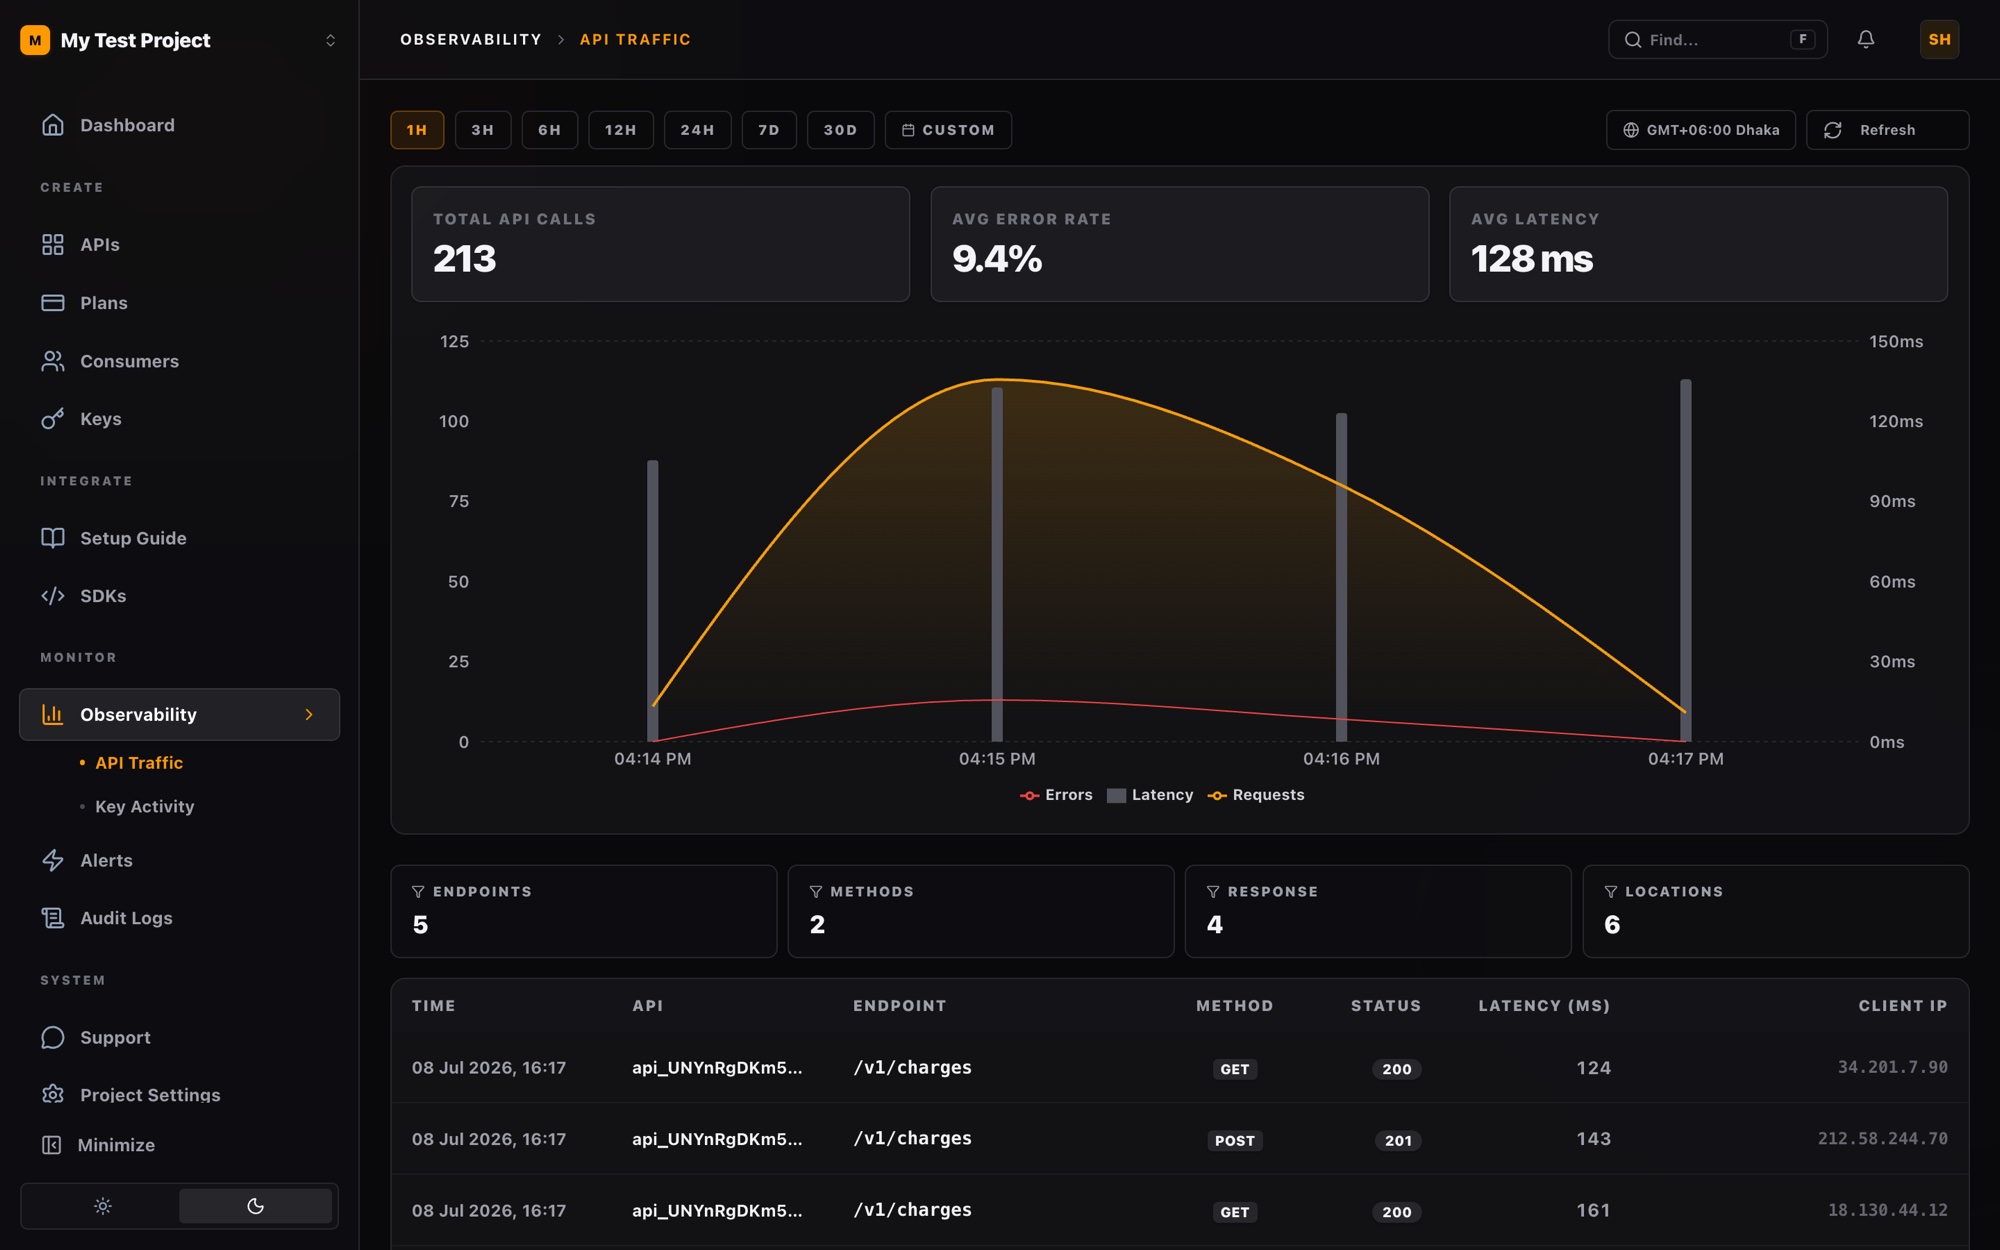
Inspect method, path, status, latency, location, and consumer without opening another tool.
- Endpoint and method filters
- Status and latency ranges
- Region and client IP context
Move from a latency spike to the exact endpoint, response code, consumer, region, and request in a few clicks.
Traffic logging and key validation share one timeline, so access and performance never drift apart.
Inspect method, path, status, latency, location, and consumer without opening another tool.
Latency, request volume, and errors stay aligned on the same time range.
Follow a chart anomaly down to the individual request and the consumer behind it.
Request volume, error rate, latency percentiles, and the per-request log — one screen from the live dashboard.
Pass the requestId from validation plus whatever metadata you want to keep. ReqKey correlates the two, and the request shows up on the timeline within seconds.
See the full ingestion reference// After your API responds — fire and forgetawait fetch('https://api.reqkey.com/ingest', { method: 'POST', headers: { Authorization: `Bearer ${REQKEY_ROOT_KEY}` }, body: JSON.stringify({ requestId, // returned by /key/validate method: 'POST', endpoint: '/v1/payments', statusCode: 200, latencyMs: 45, }),})Method, path, and status.
Volume, errors, latency.
Endpoint or consumer.
Get the full context.
Start free with 5 million requests a month. Wire up ingestion once and the timeline fills within seconds.